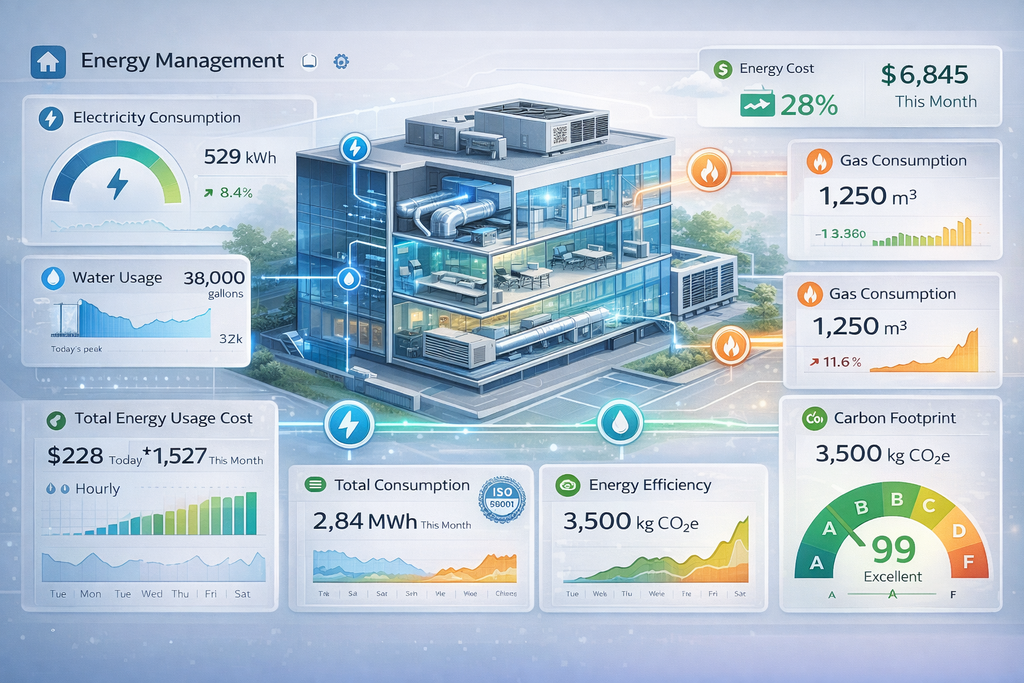
Real-Time Energy Management & Sustainability Platform
Monitor and optimize consumption of electricity, gas, water, steam, and renewable energy sources in real-time. Track carbon footprint, achieve ISO 50001 certification, reduce waste, and meet ESG goals. FacilityFlow customers typically achieve 20-30% energy cost savings in the first year.
Stop Wasting Energy, Start Saving Money
- Energy costs are one of the largest controllable expenses for facilities, yet most organizations have no real-time visibility into where energy is being consumed or wasted. Without detailed data, you're flying blind—unable to identify opportunities, justify investments, or meet sustainability commitments.
- FacilityFlow's Energy Management module transforms energy from a fixed cost to an optimized resource. Connect your utility meters (electricity, gas, water, steam) via IoT sensors or integrate with existing building management systems to gain real-time visibility into consumption at the building, floor, zone, and even equipment level.
- Our platform automatically identifies waste, benchmarks performance, alerts you to anomalies, and tracks progress toward reduction goals—all while generating the reports needed for ISO 50001 certification and ESG disclosures.
The Numbers Speak for Themselves
Real results from real customers
Typical Cost Savings
Achieved in first year through waste identification
Real-Time Updates
Live consumption data refreshed every second
Utility Types
Track electricity, gas, water, steam, renewables & more
Compliance Ready
Built-in reporting for energy management certification
Based on 2024 customer survey of 250+ companies
Complete Energy & Sustainability Management
💡 Track Every Energy Source in Real-Time
Monitor all utilities—electricity, gas, water, steam, chilled water, compressed air, fuel oil, and renewable energy—from a single platform. Submeter by area, floor, tenant, or equipment for detailed visibility. Features include real-time consumption tracking, multi-currency cost calculations with tariffs, submetering, peak demand alerts, renewable generation tracking, and comparison tools versus budget or previous periods.
💰 Accurate Cost Allocation for Departments & Tenants
Automatically allocate energy costs to departments, cost centers, tenants, or business units based on actual consumption or square footage. Generate invoices, cross-charge internal departments, and ensure fair distribution of shared costs. Features include automatic allocation, multi-rate tariffs, tenant billing, department chargebacks, budget tracking, and tax/surcharge calculations.
🌱 Comprehensive Carbon Footprint & ESG Reporting
Automatically calculate Scope 1, 2, and 3 carbon emissions from energy consumption. Track reduction goals, benchmark against industry standards, and generate ESG-ready reports (GRI, CDP, SASB) for stakeholder communications. Features include automated CO2e calculations, emissions tracking, REC integration, carbon offset management, goal monitoring, and sustainability reporting.
🤖 Intelligent Alerts for Waste & Anomalies
Machine learning analyzes consumption patterns to detect anomalies—after-hours usage, spikes, leaks, and inefficiencies. Receive instant alerts via email, SMS, or app, and automatically create work orders. Features include ML-based anomaly detection, threshold and schedule monitoring, leak detection, multi-channel notifications, and automatic alert-driven actions.
📈 Data-Driven Efficiency Recommendations
FacilityFlow’s analytics engine identifies energy-saving opportunities by analyzing consumption patterns, equipment performance, and schedules. Receive prioritized recommendations with ROI and payback periods. Features include building efficiency scoring, equipment performance monitoring, schedule optimization, load/power factor analysis, weather-normalized comparisons, and improvement ROI calculations.
📜 ISO 50001 Energy Management System Compliance
Built-in tools simplify ISO 50001 certification. Track EnPIs, maintain energy baselines, manage objectives and targets, and generate required reports and audit documentation. Features include EnPI tracking, baseline monitoring, action plan and milestone tracking, compliance documents, automated audit reports, management review dashboards, and continual improvement monitoring.
Seamless Integration with Meters, BMS & IoT Sensors
🔌 Direct Meter Integration
Connect directly to smart meters via Modbus RTU/TCP, BACnet, or M-Bus protocols. FacilityFlow supports interval data collection from 1-second to 1-hour intervals depending on meter capabilities. Works with all major meter manufacturers: Schneider Electric, Siemens, GE, Honeywell, ABB, Eaton, and more.
🏢 BMS/SCADA Integration
Integrate with existing building management systems via BACnet/IP or OPC-UA. Read data from HVAC systems, lighting controls, chillers, boilers, and other building equipment. No need to replace existing infrastructure—FacilityFlow layers on top providing analytics and reporting your BMS cannot.
💧 Utility Company APIs
Pull consumption and cost data directly from utility companies that support Green Button, AMI (Advanced Metering Infrastructure), or proprietary APIs. Automatic synchronization eliminates manual data entry and ensures billing accuracy.
📡 IoT Sensor Networks
Deploy wireless IoT sensors for granular submetering in areas lacking existing meters. Use LoRaWAN, WiFi, or cellular sensors to track consumption at the equipment level. Cloud connectivity via MQTT or REST API.
Real Results from Energy Management Customers
🏭 Manufacturing Facility:
Company Type: 500,000 sq ft automotive parts manufacturer
Challenge: Rising energy costs ($850K annually) with no visibility into where energy was consumed. Utility bills showed overall usage but couldn't identify waste or justify efficiency investments.
Implementation:
- Installed 45 electricity submeters via Modbus (production lines, compressors, HVAC)
- Integrated existing natural gas meters (12 locations)
- Connected to compressed air monitoring system
- Deployed temperature sensors in production areas
Results (12 months):
- 27% reduction in energy costs ($230K annual savings)
- Identified waste: After-hours equipment left running ($45K/year waste)
- Optimized production: Shifted high-energy processes to off-peak hours (-18% demand charges)
- Compressed air leaks: detected and repaired ($32K savings)
- ROI: 8 months payback on implementation investment
🏢 Multi-Tenant Office Building:
Company Type: 1.2 million sq ft Class A office tower, 35 tenants
Challenge: Inaccurate tenant energy billing based on square footage allocation led to disputes. Large tenants with data centers felt overcharged; small tenants felt undercharged. No data to support rate negotiations with utility.
Implementation:
- Submetered each tenant floor (35 submeters)
- Integrated with existing BACnet BMS for HVAC data
- Installed occupancy sensors for common areas
- Connected to utility's Green Button API
Results (12 months):
- Fair billing: Eliminated tenant disputes with actual consumption data
- 22% energy savings in common areas through optimized HVAC schedules
- Tenant engagement: Consumption dashboards motivated tenants to conserve
- Demand response: Earned $45K annually in utility rebates by reducing peak load
- Higher rents justified: Energy transparency became competitive advantage
🏥 Hospital Campus:
Company Type: 850-bed hospital with 4 buildings, 2.5 million sq ft
Challenge: Energy represented 3rd largest expense ($4.2M annually). Committed to carbon neutrality by 2030 but lacked baseline data. Required ISO 50001 certification for sustainability reporting.
Implementation:
- Integrated existing BMS (Siemens Desigo) with 200+ points
- Deployed 80 new electricity submeters for departments and equipment
- Connected steam, chilled water, and medical gas meters
- Implemented weather station integration for normalization
Results (18 months):
- 18% energy cost reduction ($756K annual savings)
- Carbon emissions reduced by 2,340 tons CO2e (15% reduction)
- ISO 50001 certified ahead of schedule
- Energy transparency: Department-level consumption visibility enabled accountability
- Predictive maintenance: Energy anomalies identified equipment problems early
- On track for carbon neutrality goal with clear roadmap
🏬 Retail Chain
Company Type: 450 retail locations across 12 states
Challenge: Inconsistent energy performance across locations ($28M annually). No way to benchmark stores or identify underperformers. Manual utility bill entry was error-prone and time-consuming.
Implementation:
- Integrated Green Button data from 15 utilities automatically
- Deployed IoT electricity monitors in all stores (3 per store: HVAC, lighting, plugs)
- Weather normalization based on store location
- Store benchmarking dashboard
Results (24 months):
- 24% energy reduction across portfolio ($6.7M annual savings)
- Identified outliers: 47 underperforming stores flagged for improvement
- Best practices sharing: Top 10% store efficiency strategies deployed chain-wide
- Automated billing: Eliminated manual entry, reduced errors by 98%
- Predictive equipment replacement: Saved $890K by targeting least efficient stores first
Everything You Need for Energy Excellence
🏭 Monitoring & Metering
Real-time consumption tracking (all utilities), interval data (1s–1h), unlimited submeters, multi-site management, weather normalization, degree day analysis, load profiling, peak demand tracking, power quality monitoring, renewable energy tracking.
📊 Analysis & Reporting
Carbon footprint calculation (Scope 1,2,3), cost allocation and tenant billing, budget vs actual tracking, multi-rate tariff support, benchmarking (internal & industry), energy intensity metrics (EnPIs), ML-based anomaly detection, efficiency scoring, ROI calculator for improvements, predictive analytics.
📜 Compliance & Action
ISO 50001 compliance tools, ESG reporting (GRI, CDP, SASB), audit-ready documentation, automated alerts and notifications, work order integration, action plan tracking, goal setting and progress tracking, utility bill validation, demand response integration, energy procurement support.
Affordable Energy Management with Rapid ROI
Energy management simplified: monitor all utilities, track carbon footprint, stay ISO 50001 compliant, and get actionable insights with rapid ROI. No per-meter fees, no hidden costs, and a 30-day free trial.
Standard
Small teams and offices
$200/user/year (save 17%)
Users: Unlimited
Storage: Unlimited
What's included:
Energy management simplified: monitor all utilities, track carbon footprint, stay ISO 50001 compliant, and get actionable insights with rapid ROI. No per-meter fees, no hidden costs, and a 30-day free trial.
Get Started in Minutes, Not Months
Most teams are live and productive within 3 days
Baseline & Quick Wins
Install meters, establish baseline, identify quick wins, fix after-hours waste, optimize schedules, repair leaks. Expected savings: 5-10%.
Strategic Improvements
Equipment upgrades, Process optimization, Behavioral programs, Expected savings: 15-25%
Continuous Optimization
Advanced analytics, Predictive optimization, Deep retrofits, Ongoing efficiency gains
Energy Management Connects Across FacilityFlow
Energy Management FAQs
Start Saving Energy and Money Today
Join hundreds of organizations reducing energy costs by 20-30% with FacilityFlow. Start your free 30-day trial—no credit card required.