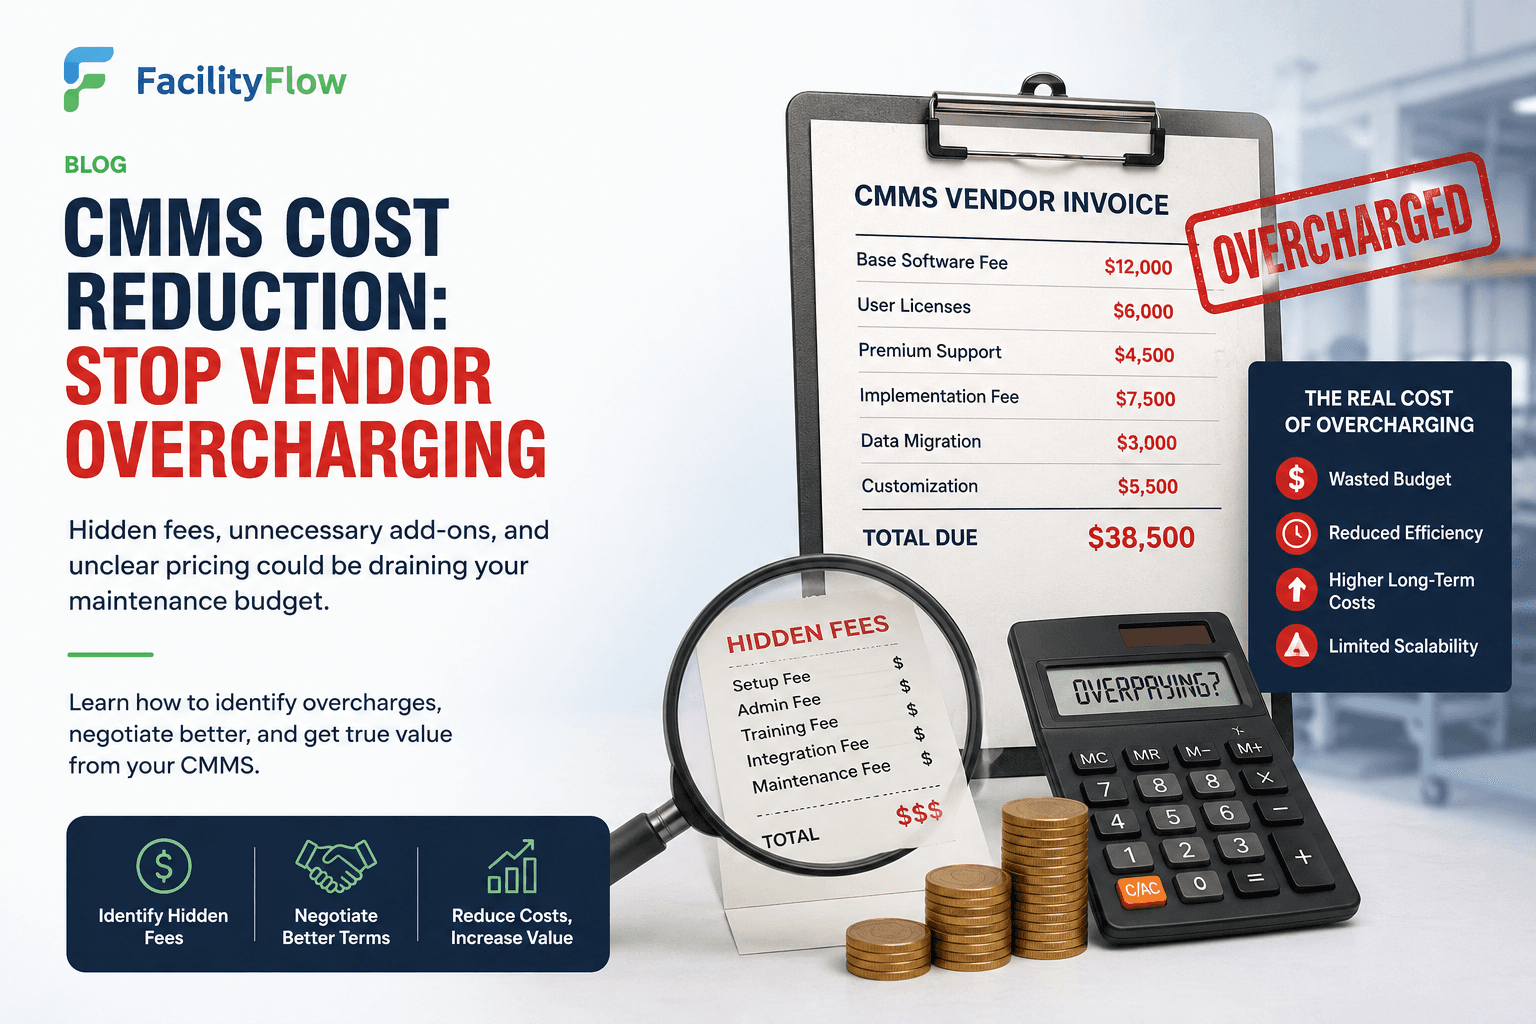
Vendor management in facility management is one of the most financially significant activities in the operation — and one of the least systematically managed. Most FM organisations have a contractor network built over years through a combination of tendering, relationship management, and operational necessity. That network is rarely reviewed with the rigour applied to capital expenditure.
The result is financial leakage that accumulates steadily, largely invisible, across three categories: billing above contracted rates, labour and materials charges that do not match the scope of work completed, and operational waste from inefficient parts consumption, excess stock, and suboptimal repair decisions.
FacilityFlow's Cost Optimisation Agent addresses all three categories through systematic automated analysis — checking every invoice against the contracted rate schedule, tracking parts consumption patterns against asset maintenance requirements, and identifying inefficiency patterns that a manual review process would never surface in time to act on.
The Invoice Audit Process
The Cost Optimisation Agent's invoice audit functionality connects to the purchase order and invoice management workflow, pulling each incoming contractor invoice and running it through a four-stage verification process.
Stage one is rate verification. The agent compares each labour charge line on the invoice against the current contracted rate schedule for the relevant contractor, trade, and call-out type. Standard hours, out-of-hours, and emergency rates are all tracked separately. An invoice charging emergency callout rates for work completed during standard operating hours is flagged immediately for review.
Stage two is scope verification. The agent cross-references the invoice against the originating work order, checking that the work billed matches the work authorised. Additional charges not covered by the original work order scope generate automatic queries. Charges for materials not specified in the parts list for the relevant job type are flagged for technician verification.
Stage three is historical rate comparison. The agent compares the invoice rates against the historical rate data for the same contractor across all previous invoices. Rate creep — where contractors gradually increase rates beyond contracted levels across successive invoices, often below the individual invoice review threshold — is one of the most common forms of overcharging in FM, and one of the most difficult to detect through manual review. Systematic comparison across the invoice history makes it visible immediately.
Stage four is benchmark comparison. The agent compares the total cost of each completed job against benchmark costs for the same job type, asset category, and regional market. Jobs priced significantly above market benchmark trigger an advisory flag — a recommendation for the procurement team to review the contractor rate schedule at the next review point.
Parts Consumption Analysis
Beyond labour and call-out charges, the Cost Optimisation Agent analyses parts consumption patterns across the maintenance programme to identify inefficiency and waste.
Parts overcharging takes several forms in FM operations. Contractors billing for parts at list price when contracted rates should apply. Spare parts charged to a job but not actually installed — a practice sometimes called parts padding that is difficult to detect without systematic cross-referencing. Consumables billed at premium rates through the contractor's supply chain when the same items are available through the FM organisation's own procurement framework at significantly lower cost.
The consumption analysis also identifies patterns of excessive parts usage that suggest poor repair quality. An asset that requires the same component replaced three times in 18 months has either a poor quality component being specified, a recurring root cause that is not being addressed, or a contractor billing for replacement work that is not being done to specification. Any of these patterns warrants investigation — and the Cost Optimisation Agent surfaces them automatically rather than waiting for a manager to notice through anecdotal observation.
Tracking Labour Against Job Complexity
One of the subtler forms of cost inefficiency in FM operations is the systematic billing of excess labour hours for jobs that should be completed within a defined time parameter. A routine planned maintenance service for a specific asset type takes a defined number of hours. If a contractor consistently bills 40 to 60 percent more hours than the benchmark for the same job type, either the benchmark is wrong or the labour efficiency is poor.
The Cost Optimisation Agent tracks labour hours billed against job type benchmarks, flagging contractors whose billing patterns consistently deviate from the expected range. This is particularly valuable in cost-plus contracts where the FM organisation is bearing the risk of labour cost overruns — and where the incentive for the contractor to work efficiently is limited.
The analysis also tracks the resolution rate by contractor and job type — measuring whether jobs are actually fixed on the first visit or whether they require multiple return visits to achieve resolution. A contractor with a 60 percent first-time fix rate is generating twice the number of callouts needed to maintain the asset base, with all the associated overhead of additional scheduling, access management, and invoice processing.
Operational Waste Identification
Beyond vendor-related cost issues, the Cost Optimisation Agent analyses operational patterns to identify sources of internal waste that do not show up in contractor invoices.
Deferred planned maintenance is one of the most common sources of avoidable cost in FM operations. When planned maintenance is deferred — because reactive work has consumed team capacity, the budget line has been cut, or through scheduling slippage — the result is typically an increase in reactive failure costs that significantly exceeds the saving from the deferred planned work.
The Cost Optimisation Agent tracks planned maintenance completion rates by asset class and calculates the projected reactive cost impact of deferred PM based on historical failure rate data. This gives operations managers a forward-looking view of the cost of deferring maintenance — a view that is often sufficient to justify protecting the PM budget even in periods of financial pressure.
Stock and Inventory Optimisation
Parts inventory represents a significant tied-up cost in FM operations — stock that is purchased speculatively, sits in storerooms, and either gets consumed eventually or is written off as obsolete. The Cost Optimisation Agent analyses the relationship between parts held in inventory and actual consumption rates, identifying slow-moving stock, duplicate holdings across multiple sites, and parts that are consistently sourced reactively at premium prices despite being predictably consumed.
The inventory recommendations generated by the agent typically identify opportunities to reduce total stock value by 15 to 25 percent through better inventory positioning — holding the right parts at the right sites based on actual consumption patterns rather than historical purchasing habits. The working capital freed from inventory rationalisation often exceeds the value of the recovered overcharging in the first year of deployment.
The 2 Percent Recovery Benchmark
Across deployments with comprehensive invoice and work order data integration, the Cost Optimisation Agent consistently identifies recoverable overcharging and inefficiency representing one to two percent of total annual maintenance spend.
For a mid-size FM operation spending £3 million annually on maintenance contracts, a 2 percent recovery represents £60,000 per year. This figure is achieved not through renegotiating contracts or changing contractors, but through systematic identification of billing errors, rate violations, and consumption inefficiencies that would otherwise never surface.
The recoverable amount typically comprises: direct billing errors and rate violations (approximately 40 percent of the total), excess labour hours (approximately 35 percent), and parts overcharging (approximately 25 percent). Each category requires a different remediation approach — formal invoice queries, rate schedule reviews, or parts procurement framework changes — but all are achievable through standard commercial processes once the data has been surfaced by the agent.
