Transform Facility Data into Actionable Intelligence
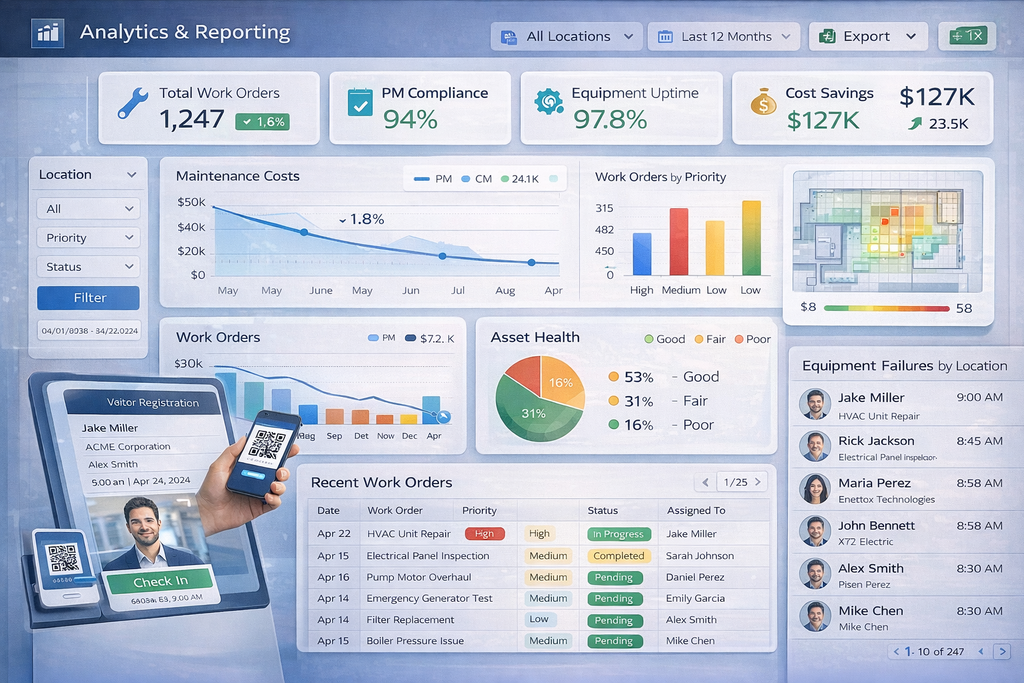
Make data-driven decisions with 200+ pre-built reports, customizable dashboards, and real-time KPI tracking. Monitor maintenance costs, analyze equipment performance, measure team productivity, and identify optimization opportunities—all with drill-down analytics and one-click Excel export.
Turn Your Facility Data into Strategic Advantage
Facility managers are drowning in data but starving for insights. Spreadsheets scattered across departments, manual report compilation taking hours, and outdated metrics that don't reflect current operations. FacilityFlow's Advanced Analytics & Reporting transforms raw facility data into actionable intelligence with 200+ pre-built reports, customizable dashboards, and AI-powered insights.
Whether you're tracking maintenance costs, monitoring equipment reliability, measuring team efficiency, or proving ROI to stakeholders, our analytics platform delivers the metrics that matter—updated in real-time, accessible anywhere, and exportable to any format you need.
Why Advanced Analytics Matters:
- Facility executives and operations managers choose FacilityFlow's analytics because it eliminates manual reporting, surfaces hidden inefficiencies, quantifies cost savings, and provides the evidence needed to secure budget approvals. When you can prove that predictive maintenance reduced downtime by 40% or that your team completed 30% more work orders, you transform facility management from a cost center into a strategic value driver.
Key Capabilities of FacilityFlow
200+ Pre-Built Reports
Access comprehensive report library organized into 8 categories: Asset Management (35 reports), Work Orders (42 reports), Preventive Maintenance (28 reports), Inventory (24 reports), Financial (31 reports), Labor & Productivity (26 reports), Energy & Utilities (18 reports), and Compliance & Safety (16 reports). Every report includes customizable parameters, scheduled delivery, and export options.
Drag-and-Drop Dashboard Builder
Create custom dashboards in minutes without coding. Choose from 15+ visualization types (line charts, bar graphs, pie charts, heat maps, gauges, tables), add KPI cards, set auto-refresh intervals, and arrange layouts with simple drag-and-drop. Share dashboards across teams or keep private for executive review.
Real-Time KPI Monitoring
Track critical performance indicators with live updates: Overall Equipment Effectiveness (OEE), Mean Time Between Failures (MTBF), Mean Time To Repair (MTTR), Preventive Maintenance Compliance, Work Order Completion Rate, Emergency Response Time, Backlog Ratio, Labor Utilization, and Cost per Square Foot. Set thresholds and receive alerts when KPIs drift.
Advanced Filtering & Drill-Down
Every chart and table supports multi-level drill-down from enterprise-wide metrics to individual asset details. Apply filters by location, department, asset type, technician, date range, cost center, and custom fields. Save filter combinations for quick access to frequently viewed data segments.
Automated Report Scheduling
Schedule any report to run automatically (daily, weekly, monthly, quarterly, annually) and deliver results via email to stakeholders. PDF attachments for executive summaries, Excel files for detailed analysis, or dashboard links for interactive exploration. Set different schedules for different audiences.
Predictive Analytics Integration
Advanced analytics powered by FacilityFlow's AI models surface actionable insights: equipment likely to fail in next 30 days, maintenance tasks with highest ROI potential, inventory items trending toward stockout, cost anomalies requiring investigation, and efficiency opportunities based on pattern recognition across similar facilities.

Technical Specifications
Data Architecture
- Database Performance:
- Report generation: < 5 seconds for standard reports, < 30 seconds for complex aggregations
- Dashboard load time: < 2 seconds for cached data, < 10 seconds for real-time queries
- Data freshness: Real-time updates (< 1 minute latency) for live dashboards
- Query optimization: Automatic indexing and query caching
- Data Storage:
- Retention: 7 years minimum (configurable up to unlimited)
- Historical data: Full detail retention with archival compression
- Data backup: Automated daily backups with 30-day retention
- Point-in-time recovery: Restore to any moment in past 30 days
- Scalability:
- Supports: Unlimited reports, dashboards, and data rows
- Concurrent users: 500+ simultaneous dashboard viewers
- Data volume: Tested with 100M+ records per facility
- Performance: Auto-scaling infrastructure maintains speed as data grows
Report Engine Capabilities
- Computation Features:
- Aggregations: Sum, average, count, min, max, median, standard deviation
- Calculations: Year-over-year growth, percentage change, variance analysis
- Running totals and cumulative sums
- Moving averages (7-day, 30-day, custom periods)
- Ratio calculations (e.g., PM-to-reactive work ratio)
- Budget variance (actual vs. planned)
- Forecasting: Linear regression, exponential smoothing
- Visualization Engine:
- Rendering: HTML5 canvas for performance, SVG for print quality
- Interactivity: Zoom, pan, hover tooltips, click-through drill-downs
- Responsive: Auto-adapts to screen size and orientation
- Accessibility: WCAG 2.1 AA compliant, screen reader support
- Animation: Smooth transitions when data updates
Export Formats
- Excel (.xlsx):
- Formatted workbooks with multiple sheets
- Preserved formulas and formatting
- Charts and pivot tables included
- Cell styling (colors, fonts, borders)
- Max size: 1M rows per sheet
- PDF:
- Professional layout with headers/footers
- Custom branding (logo, colors, fonts)
- Multi-page support with page breaks
- Embedded charts as vector graphics (scalable)
- Secure PDFs with password protection
- CSV:
- Standard comma-delimited format
- UTF-8 encoding for international characters
- Configurable delimiter (comma, tab, semicolon)
- Header row included
- No row limits (multi-GB files supported)
API & Integration
- REST API:
- Endpoints: /api/v1/reports, /api/v1/dashboards, /api/v1/data
- Authentication: OAuth 2.0, API keys
- Rate limits: 1,000 requests/hour (configurable)
- Response formats: JSON, XML
- Pagination: Cursor-based for large datasets
- BI Tool Connectors:
- Power BI: Native connector via Microsoft AppSource
- Tableau: Web Data Connector (WDC)
- Looker: LookML models and Explore definitions
- Qlik: REST connector
- Sisense: ElastiCube import
- Domo: Dataset connector
- Data Warehouse Integration:
- Snowflake: Native connector with automatic schema sync
- Amazon Redshift: COPY command integration
- Google BigQuery: Streaming insert API
- Azure Synapse: Polybase integration
- Real-time sync or scheduled batch loads
Security & Compliance
- Data Security:
- Encryption: AES-256 at rest, TLS 1.3 in transit
- Access control: Row-level security based on user permissions
- Audit logging: All report views, exports, and data access logged
- Data masking: Automatic PII redaction for non-privileged users
- Compliance Standards:
- SOC 2 Type II certified
- GDPR compliant with data retention policies
- HIPAA-compliant architecture (BAA available)
- ISO 27001 information security management
- Regular penetration testing and security audits
Use Cases
~> Manufacturing Operations Director
Challenge: A manufacturing director managing 3 plants needs to prove ROI of new CMMS investment to CFO. Current reporting requires 2 days/month of manual Excel work, and data is outdated by the time stakeholders see it.
Solution: Custom executive dashboard displays real-time KPIs: Overall Equipment Effectiveness (OEE increased from 72% to 84%), Unplanned Downtime (reduced 42%), Maintenance Cost per Unit (down 28%), and PM Compliance (up to 96%). Automated monthly PDF reports email to CFO showing YoY improvements with charts and variance explanations.
Results:
- Reporting time: 2 days/month → 15 minutes/month (95% reduction)
- Budget approval: Secured 20% increase based on quantified savings
- Decision speed: Real-time dashboards enable daily course corrections
- Stakeholder confidence: CFO now reviews dashboards weekly instead of quarterly
~> Healthcare Facilities Manager
Challenge: A hospital facilities manager must demonstrate regulatory compliance across 5 buildings while managing $12M annual maintenance budget. Manual reports for Joint Commission audits take weeks to compile, and cost tracking is reactive rather than proactive.
Solution: Pre-built compliance dashboard tracks: Equipment inspection status (by department and criticality), certification expiration dates, preventive maintenance completion rates, and incident response times. Cost analysis reports identify budget variances by department, allowing proactive intervention before overspending.
Results:
- Joint Commission audit preparation: 3 weeks → 2 hours
- Compliance score: 94% → 99.2% (all life safety systems tracked)
- Budget variance: Detected and corrected $180K projected overspend in Q2
- Leadership visibility: Board now receives monthly compliance dashboard
~> Corporate Real Estate Portfolio Manager
Challenge: Portfolio manager overseeing 45 office buildings across 12 cities lacks standardized metrics. Each site reports different KPIs, making portfolio-wide optimization impossible. Energy costs vary wildly between similar buildings with no visibility into root causes.
Solution: Enterprise dashboard aggregates all 45 sites with standardized metrics: Cost per Square Foot, Energy Use Intensity (kWh/sq ft), Work Order Completion Rate, Tenant Satisfaction scores. Drill-down capability reveals that 8 buildings have 40% higher energy costs due to deferred HVAC maintenance, allowing targeted capital investment.
Results:
- Portfolio visibility: First time seeing all 45 buildings in single view
- Energy savings: $420K annual reduction after HVAC optimization
- Standardization: All sites now report same 15 core KPIs
- Capital planning: Data-driven $2.1M renovation prioritization
~> University Facilities Management
Challenge: University managing 120 buildings struggles to justify capital requests to board of trustees. Deferred maintenance backlog is estimated at $15M but lacks concrete data to prioritize projects or demonstrate consequences of delayed investment.
Solution: Asset lifecycle reports show equipment age, remaining useful life, and replacement costs for all critical systems. Failure rate analysis quantifies risk of emergency breakdowns. Total Cost of Ownership (TCO) reports compare repair vs. replace scenarios with 5-year projections.
Results:
- Capital funding: Secured $4.2M based on risk-prioritized project list
- Deferred maintenance: Reduced backlog by $3.1M (21%) in first year
- Emergency failures: Down 58% after replacing high-risk equipment
- Board confidence: Quarterly asset health reports now standard
~> Multi-Site Retail Chain
Challenge: Retail chain with 200 stores needs to track maintenance performance across regions. Current metrics don't distinguish between high-performing and underperforming sites. Regional managers have no visibility into their teams' efficiency.
Solution: Regional dashboards compare stores within each territory: Work Order Response Time, Technician Productivity (work orders per day), Vendor Cost Efficiency, and Equipment Downtime Impact on Sales. Benchmarking reveals top performers averaging 22 work orders/day vs. bottom performers at 8 work orders/day—enabling targeted training and best practice sharing.
Results:
- Regional performance: Identified 3 underperforming regions for coaching
- Productivity gain: Low performers improved from 8 to 16 work orders/day (100% increase)
- Cost reduction: Vendor benchmarking saved $340K annually
- Sales impact: Reduced store closures due to equipment failure by 73%
Advanced Analytics & Reporting FAQ's
Ready to Transform Your Facility Data?
Join 5,000+ facility managers who stopped spending hours on spreadsheets and started making data-driven decisions with FacilityFlow's Advanced Analytics & Reporting. Start your free 30-day trial today—all reports and dashboards included, no credit card required. ✓ 200+ Pre-Built Reports - ✓ Real-Time Dashboards - ✓ One-Click Export - ✓ 24/7 Support